Next: Links Menu Up: Data Menu Previous: Table Contents
The results of the fuzzy inference performed on a whole data set are saved in a text file, readable in a spreadsheet. The file format, in particular the number of columns, depends on the type of defuzzification operator chosen for each output and on the classification flag. It is detailed in section 2, part II.
For instance, in the case of a crisp output, and with the
classification option selected, each inferred value is recorded, with
the class that it was assigned to.
In case of multiple output, one of them must be selected in the
inference window.
When the observed output is present in the data file, it is compared
to the inferred output. A performance index is given. In the
classification case, it is the number of misclassified
examples. Otherwise, three numerical indices are given, PI,
RMSE et MAE as defined in the glossary section
(voir section IV.
A performance summary file is written, see 2 that
describes its format.
Note: all learning procedures are guided and characterized by RMSE.
The same viewing options are available for graphical representation as in the Data menu: histograms, X-Y plots with or without a regression line, or confusion matrix for classification data.
If the Links between rules and data option was chosen in the inference window, additional information is available in the X-Y plot by moving the mouse over a data point: line number in the data file, and activated rule numbers (beyond the activation threshold).
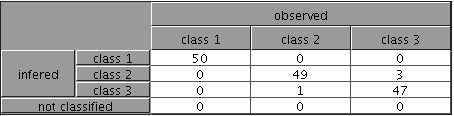
For a classification system, the result is a confusion matrix. The example given in the figure 1 shows that the 50 examples of class 1 are well classified, 49 examples of class 2 are well classified and 1 is misclassified (inferred class=3), 47 examples of class 3 are well classified and 3 are misclassified (inferred class=2).
Note: classification corresponds to a crisp output, with the classification option checked.
Implicative outputs
For implicative outputs, the X-Y graph plots the inferred value as an interval centered on the defuzzified value, and bounded by the minimum and maximum kernel values of the inferred possibility distribution.
A new menu option is available for viewing results of implicative rules. It gives a cumulated matching degree of inferred outputs with observed ones. This option is inspired from the classification confusion matrix, but it takes into account the specificity of inferring an output possibility distribution and not a single defuzzified value, as this is the case for conjunctive rules.
The matching degree varies between 0 and 1 for each item. It is computed using the intersection of the inferred possibility distribution with output fuzzy sets, and also considering the distribution width. The result is cumulated over all data file items, and displayed as a table, with one row per output fuzzy set, a Matching degree column and an Item one.
Warning: Whatever the type of rules, implicative or conjunctive, the performance index only takes into account the examples that activate the rules beyond the chosen threshold (default value is ![]() ).
).